Optimizing RDS and SQL queries in Data Analytics System
Optimizing RDS and SQL queries in Data Analytics System
We had a Data Analytics system that was firing SQL queries on AWS RDS
instance. The queries took time where the longest recorded time was 1.5
hours. We looked both at the SQL queries and AWS Infrastructure to analyze
the issue.
A. AWS INFRASTRUCTURE
2. Why did this issue occur ? : We monitored below RDS performance metrics using CloudWatch :
- ReadLatency (The average amount of time taken per disk I/O operation.)
- WriteLatency (The average amount of time taken per disk I/O operation.)
- DiskQueueDepth (The number of outstanding IOs (read/write requests) waiting to access the disk.)
- ReadIOPS (The average number of disk I/O operations per second)
- WriteIOPS (The average number of disk I/O operations per second)
- SwapUsage (The amount of swap space used on the DB instance)
- FreeableMemeory (How much RAM is available on the DB instance, in megabytes.)
- Our storage device attached to RDS instance was “General Purpose (SSD) ” of capacity 200 GB.
- The above “General Purpose (SSD) ” storage provided a baseline performance of 3 IOPS per GB. Thus 200 GB volume came with max 600 IOPS.
- By summing up the ReadIOPS and WriteIOPS, we saw how much IOPS our operations consume.
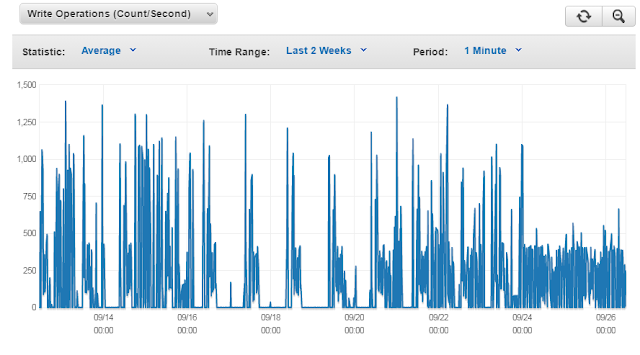
- Based on the captured performance metric graphs, our RDS IOPS in peak times was roughly = 3500 IOPS (Average Read-IOPS in peak times is 2000 and Average Write-IOPS in peak times is 1500 ). See below graphs.
Write-IOPS :
Read-IOPS :
2b. DiskQueueDepth
- This metric was high since our Read and Write Latency was high.
- The optimal count of DiskQueueDepth should be in single digit.
- Based on the captured performance metric graphs, our RDS DiskQueueDepth in peak times was roughly = 40 counts
2c. ReadLatency and WriteLatency
- Typical values for latency are in the millisecond (ms); for example, Amazon RDS reports 2 ms as 0.002 seconds.
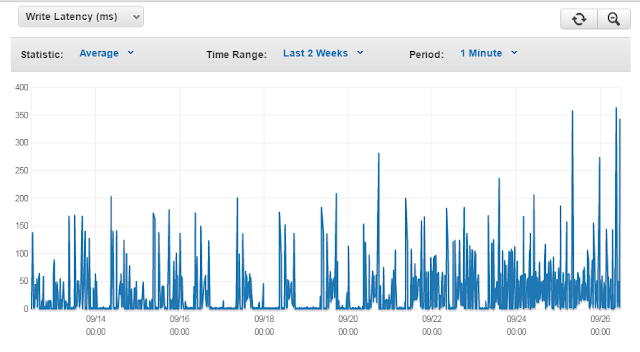
- Based on the captured performance metric graphs, our RDS actual latency during peak times was = 350 ms (Write Latency) and 80 ms (Read Latency)
- This means our read and writes were taking longer to execute.
Write-Latency :
Read-Latency :
2d. FreeableMemory and SwapUsage
- If SwapUsage and IOPS are high, that means queries working set is not able to fit in the memory.
- FreeableMemeory was pretty low (~ 100 MB) and SwapUsage was high (~85MB)
Freeable-Memory :
SwapUsage :
3. How to resolve this issue ? : Based on above analysis, we gave below recommendations that we came up with, which was to either do (3a+3b) or (3c) as shown below :
3a. Increase storage to get more IOPS.
- Currently our storage is 200 GB, which gives a max of 600 IOPS.
- We can consider to increase storage upto 1000 GB to achieve 3000 IOPS
3b. Increase RAM
- For best IOPS performance, make sure your typical working set will fit into memory to minimize read and write operations. Thus increase memory to 16 GB.
- An Amazon RDS performance best practice is to allocate enough RAM so that your working set resides almost completely in memory. To tell if your working set is almost all in memory, check the ReadIOPS metric (using AWS CloudWatch) while the DB instance is under load. The value of ReadIOPS should be small and stable. If scaling up the DB instance class---to a class with more RAM---results in a dramatic drop in ReadIOPS, your working set was not almost completely in memory. Continue to scale up until ReadIOPS no longer drops dramatically after a scaling operation, or ReadIOPS is reduced to a very small amount.
OR
3c. Switch to Provisioned IOPS.
- Provisioned IOPS storage is designed to meet the needs of I/O-intensive workloads, particularly database workloads, that are sensitive to storage performance and consistency in random access I/O throughput.
- Using ' Provisioned IOPS storage' increases the number of I/O requests the system is capable of processing concurrently. Increased concurrency allows for decreased latency since I/O requests spend less time in a queue. Decreased latency allows for faster database commits, which improves response time and allows for higher database throughput.
- The ratio of the requested IOPS rate to the amount of storage allocated is important. The ratio of IOPS to storage, in GB, for DB instances should be between 3:1 and 10:1 for MySQL, MariaDB, PostgreSQL, SQL Server (excluding SQL Server Express), and Oracle DB instances. For example, we can start by provisioning an MySQL DB instance with 3500 IOPS and 700 GB storage (a ratio of 5:1).
- We will have to move to a different instance of RDS that supports Provisioned IOPS.
B. SQL QUERIES
1. Approach :
We enabled logs that showed us the longer running DB queries. To achieve this, we configured below params in RDS "parameter group" settings :
- slow_query_log (this param is used to create the slow query log, set to 1. The default is 0.)
- log_output (this param is used to define whether logs should be spit out in a file or DB table)
- long_query_time (This param is used to log queries whose execution time exceeds the long_query_time value. The default is 10 seconds, the minimum is 0)
Once theses params were set, we rebooted the RDS instance. This exercise gave us the queries that needed optimizations.
So here is the limit for logging - log tables are rotated every 24 hours if the space used by the table logs is more than 20 percent of the allocated storage space or the size of all logs combined is greater than 10 GB. If the amount of space used for a DB instance is greater than 90 percent of the DB instance's allocated storage space, then the thresholds for log rotation are reduced. Log tables are then rotated if the space used by the table logs is more than 10 percent of the allocated storage space or the size of all logs combined is greater than 5 GB.
When log tables are rotated, the current log table is copied to a backup log table and the entries in the current log table are removed. If the backup log table already exists, then it is deleted before the current log table is copied to the backup.
2. Procedure :
We made 2 changes in this parameter group so that we can find out slow running queries.
After this steps, we can see longer running queries (more than 10 s) in the table "mysql.slow_log". Below is the schema of table mysql.slow_log.
- Once the logs starts to accumulate, fire the below query to see the SQL queries taking more than 10 sec to execute : “select * from mysql.slow_log order by query_time desc”
- This url “https://mariadb.com/kb/en/mariadb/mysqlslow_log-table/” can explain the result set.
The query is stored as a blob in column “sql_text” - To read the query from the blob, we use “select CAST(slow_log.sql_text AS CHAR(10000) CHARACTER SET utf8) from mysql.slow_log where slow_log.thread_id="7264"
- A combined query would be : “select slow_log.start_time, slow_log.user_host, slow_log.query_time, slow_log.lock_time, slow_log.rows_sent, slow_log.rows_examined, CAST(slow_log.sql_text AS CHAR(10000) CHARACTER SET utf8) as QueryDetails from mysql.slow_log order by query_time desc”
3. Results :
After running the system with slow-query log enabled for around 18 hrs, we found top slowest queries that took 1hr-47mins, 48 mins, 39 mins and 38 mins respectively.
4. Recommendations :
- It seems few queries were essentially creating temp tables. Since we dont use the temp table multiple times, we would like to consider using derived tables. Derived table is another name for subquery - a select statement within another query. It's not persisted after the query finishes, it may not even be stored at all. A Temp table is a real table that's stored in the TempDB database, column, indexes, constraints, etc. It persists until dropped or until the procedure that created it completes or the connection that creates it closes. We will save the IO overhead of the temp tables.
- 2nd option is that if we still wanted to continue using temp tables, then "truncate" operation is faster. If we must use one table multiple times, it is faster to create the table one time and to use "truncate" multiple times if you must clean the table data. Dropping and creating table every time is an overhead.
- Optimization for queries where Indexes needs to applied. There should be an Index on columns in “where” clause. If the table has a multiple-column index, any leftmost prefix of the index can be used by the optimizer to look up rows. For example, if you have a three-column index on (col1, col2, col3), you have indexed search capabilities on (col1), (col1, col2), and (col1, col2, col3). We should also remove any indexes that are not used. Indexes are overhead for INSERT operations.
- Table "Partitions" is also an option. On the low level "Partitions" are separate tables. This means that when we’re doing lookup by partitioned key we will look at one (or some of) partition(s), however lookups by other keys will need to perform lookup in all partitions and hence can be a lot slower. Partitioning allows us to store parts of our table in their own logical space. With partitioning, we want to divide up our rows based on how we access them. If we partition our rows and we are still hitting all the partitions, it does us no good. The goal is that when we query, we will only have to look at a subset of the data to get a result, and not the whole table.
C. CONCLUSION
After applying above recommendations both on AWS Infrastructure and SQL queries, we were successful in bringing down the time of longest running query from 1hr-47mins to 9mins.
Author : Mayank Garg, Technology Enthusiast and Georgia Tech Alumni
(https://in.linkedin.com/in/mayankgarg12)


Comments
Post a Comment